History Text Analysis Over Spreadsheets - A Poker Player and Developer's Road to Agile Project Management
Ever since I started transitioning into a team leadership role over three years ago, I had been trying to find ways to eliminate waste caused by repetitive work and to keep myself on the fringe of pushing the technical boundaries.
Four months ago I started my current role where my official job title is Delivery Lead. People don’t often know what a delivery lead is, but in my mind it is a role to ensure the success of the project delivery by identifying and closing the gaps in the team and in the organisation. And in order to do that, one of our responsibilities is to measure, understand and improve our team’s agile process.
It is very tempting to rely on the wonderful and powerful Excel formulas to help record and analyse data points and generate metrics such as cycle time. However, punching things into a spreadsheet is tedious, error-prone, time consuming and violates the DRY principle.
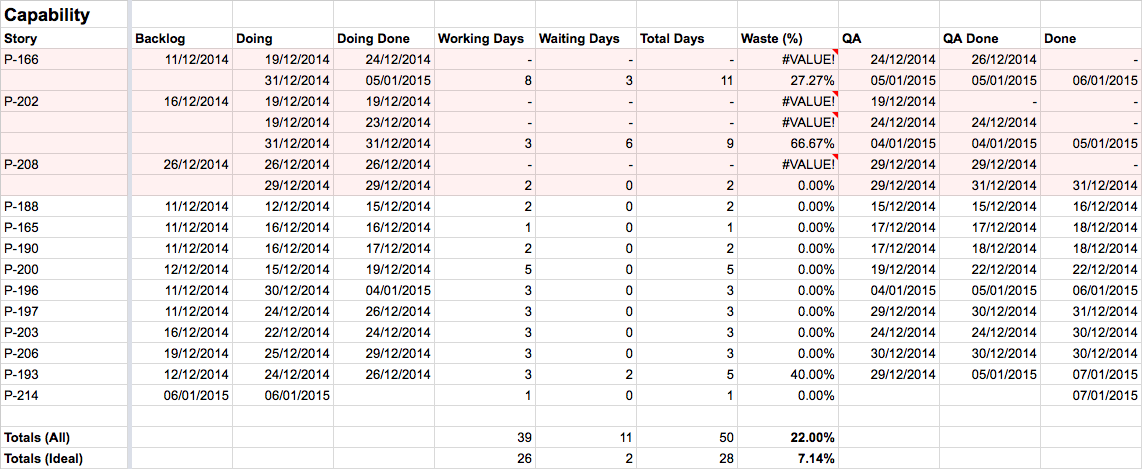
The spreadsheet I used to use for tracking cards.
Introducing Amaze Hands
As someone who strives to keep writing code even in a non-technical role, I started building a tool called Amaze Hands to help reduce the amount of waste I accumulate as a delivery lead.
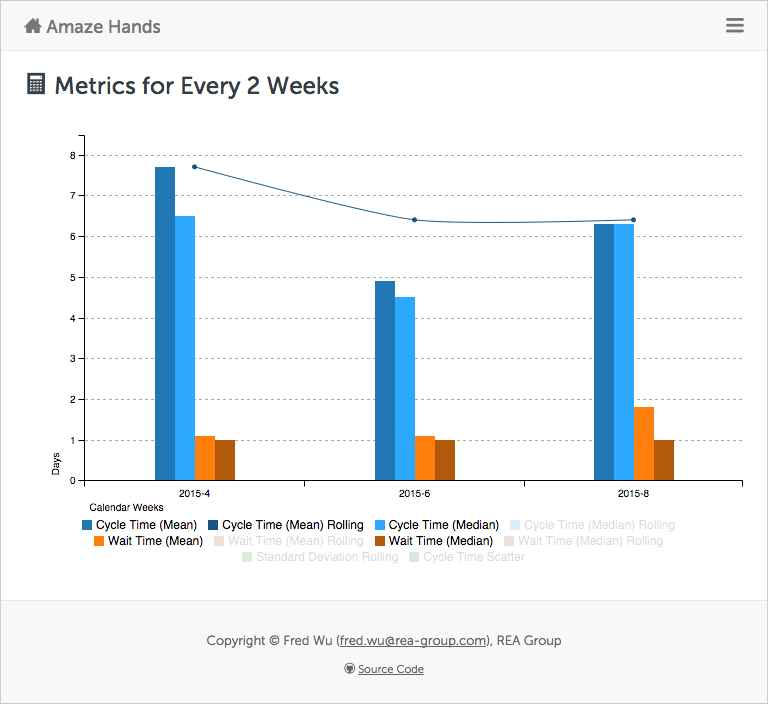
Amaze Hands’ simple Web UI.
Analyse Cards Like Poker Hands
I used to play a bit of online poker and one thing you do in online poker is to look at your hand history to understand the game and your opponents.
If you think about it, agile boards are just like poker games - there is history to what has happened in the past, and in order to optimise for future gains, we need to understand what went wrong and what to improve on a case-by-case basis.
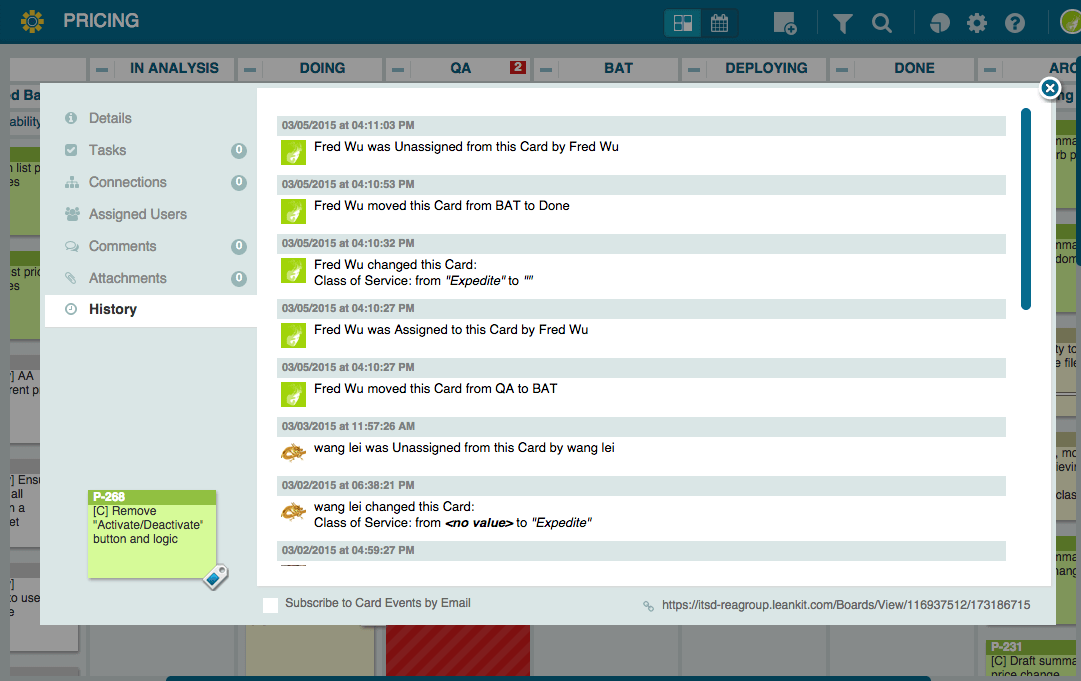
One of the teams I am apart of uses LeanKit, whilst it is a good tool, its reporting functionalities are very limited and its XML export function is completely broken. As a result I started building Amaze Hands to parse the copy-pasted card history from LeanKit, and to eventually generate the metrics I care about.
The LeanKit strategy which consists of a parser and a transformer is able to parse the copy-pasted text from a card as shown below:
And below is the high level architecture of Amaze Hands:
    +---------------------+
    |        Text         | <- Raw text input.
    +----------+----------+
               |
+--------------v--------------+
|         Strategies          |
+-----------------------------+
|   +---------------------+   |
|   |       Parser        |   | <- Parses text into an AST.
|   +----------+----------+   |
|              |              |
|   +----------v----------+   |
|   |     Transformer     |   | <- Transforms the AST into a common AST.
|   +---------------------+   |
+--------------+--------------+
               |
    +----------v----------+
    |       Builder       | <- Builds the dataset from the common AST.
    +----------+----------+
               |
    +----------v----------+
    |       Reducer       | <- Filters the dataset.
    +----------+----------+
               |
    +----------v----------+
    |      Analyser       | <- Analyses the dataset for metrics.
    +----------+----------+
               |
    +----------v----------+
    |      Producer       | <- Produces metrics.
    +----------+----------+
               |
    +----------v----------+
    |      Presenter      | <- Presents metrics.
    +---------------------+
Incremental Analysis - Zero In On Metrics That Matter
No projects are equal, and no project teams are equal - the goal of Amaze Hands is to incrementally add intelligence to our agile process that matters to a particular project and its delivery team.
By incrementally adding and/or filtering data points for analysis, we will be able to zero in on the problematic areas of our agile process. The following is a list of potential areas we could perform analysis on:
- cycle time
- wait time
- blocked time
- knocked-back time
- context switch (between different streams of work)
- other factors such as meetings, attrition, etc
As of the time of writing, Amaze Hands supports the following common metrics:
- cycle time (mean and median)
- cycle time rolling average (mean and median)
- wait time (mean and median)
- wait time rolling average (mean and median)
- standard deviation rolling average
- cycle time scatter
It’s Just the Beginning
Amaze Hands started off as an REA Hackday project - on the technical level (hey I still see myself as a developer!), the tool was built in a way that it isn’t over-engineered (a.k.a. slow to get it out the door and validate its usefulness) but at the same time has multiple layers as shown in the architecture diagram above so I could refactor and optimise each layer independently when necessary.
It is still early stage, but I thought I’d share what I have right now to gather some feedback and perhaps inspire fellow project leaders to look into optimising your own workflow.
When I started Amaze Hands I was only leading one project team that uses LeanKit, but since last week I started leading another team that uses a physical wall - I can’t wait to adapt Amaze Hands to support the new input stream.
So, do you have any interesting tools or techniques to help you lead projects? If so, I would love to hear about them!
Enjoy what you are reading? Sign up for a better experience on Persumi.